Break-Even Point vs Margin of Safety: Differences and Examples
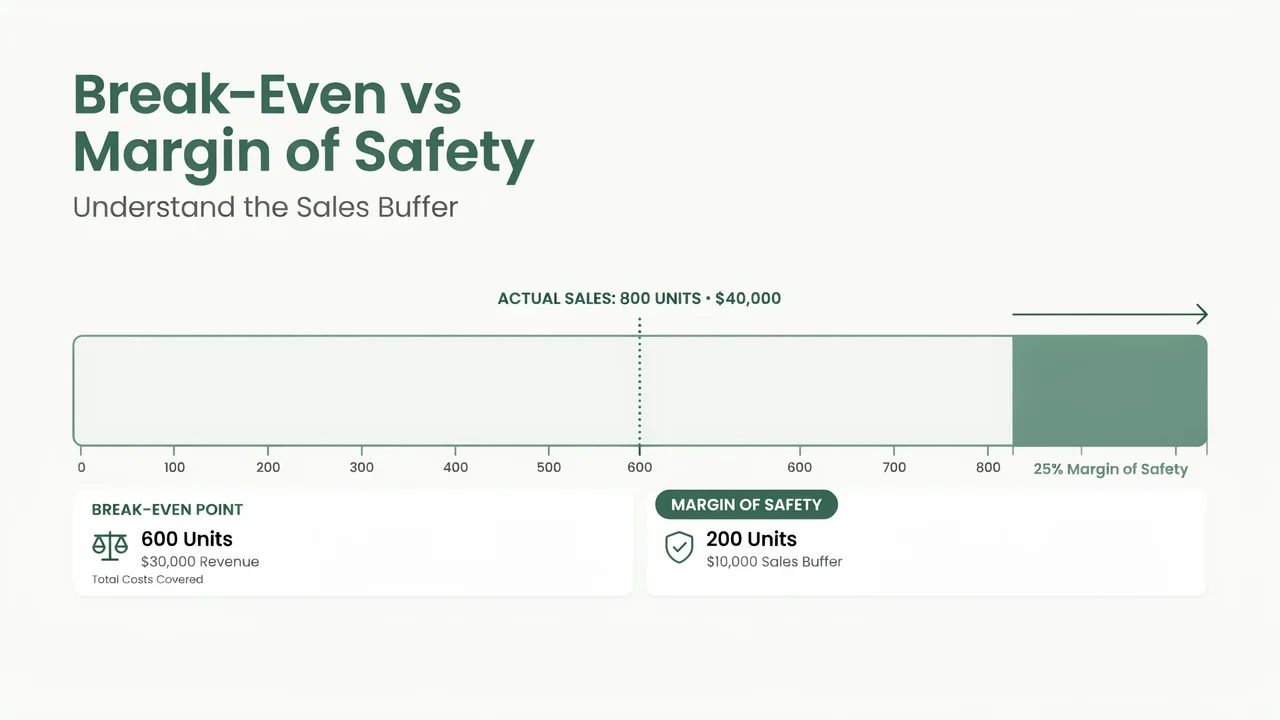
Break-even point and margin of safety are related measures, but they answer different business questions. The break-even point tells you how much a business must sell to cover its costs, while the margin of safety shows how far actual or expected sales are above that level.
For example, if a business needs to sell 600 units to break even but actually sells 800 units, it has a margin of safety of 200 units.
The first number establishes the sales threshold. The second shows how much room the business has before sales fall back to that threshold.
Understanding both measures helps businesses interpret sales performance, evaluate forecasts, and understand how changes in costs affect their position.
Break-Even Point vs Margin of Safety at a Glance
The difference between break-even point and margin of safety becomes clearer when the two measures are placed side by side.
| Comparison | Break-Even Point | Margin of Safety |
|---|---|---|
| Meaning | Sales needed to cover total costs | Sales above or below the break-even level |
| Main question | How much must we sell to avoid a loss? | How far are we from the break-even threshold? |
| Common measurement | Units or sales revenue | Units, revenue, or percentage |
| Main inputs | Fixed costs and contribution margin | Actual or expected sales and break-even sales |
| Interpretation | Identifies the zero-profit threshold | Shows the size of the sales buffer or shortfall |
| Example | 600 units | 200 units above break-even |
Both measures are part of cost-volume-profit analysis, which examines how sales volume, prices, variable costs, and fixed costs affect operating profit.
How Break-Even Point and Margin of Safety Work Together
Think of the break-even point as a starting line for profitability.
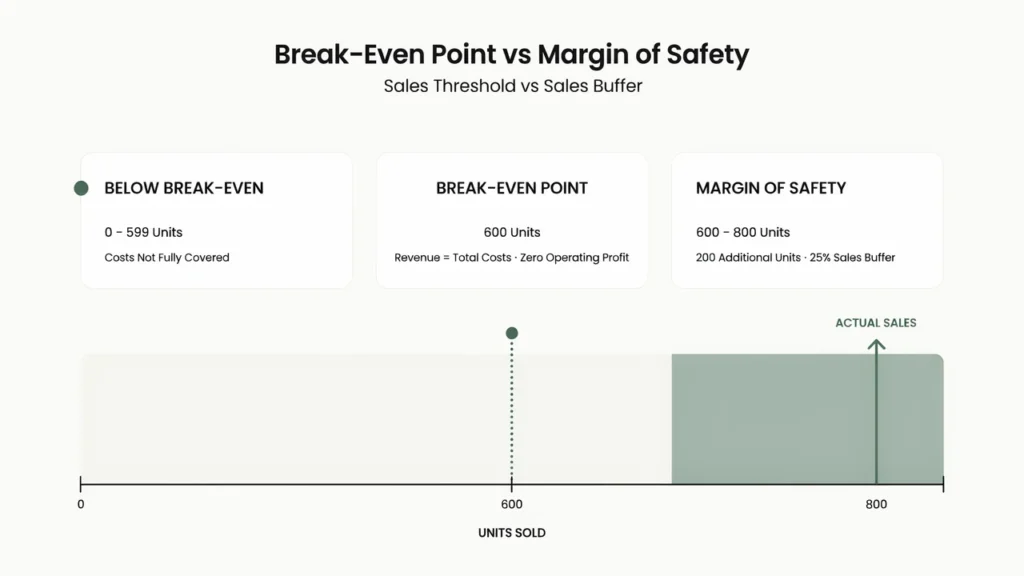
At that level, a business has generated enough contribution from sales to cover its fixed costs. Operating profit is zero under the assumptions used in the calculation.
The margin of safety compares actual or expected sales with that line.
A business selling substantially above break-even has a larger sales cushion. A business operating close to break-even has less room for sales to decline before it begins reporting an operating loss.
For example:
- Break-even sales: 600 units
- Actual sales: 800 units
- Margin of safety: 200 units
If sales fall from 800 units to 700 units, the business remains above break-even.
If sales fall to 600 units, it reaches break-even.
If sales fall below 600 units, the business operates at a loss under the same cost and pricing assumptions.
The margin of safety therefore depends on the break-even point. You cannot determine the sales cushion without first establishing the threshold against which sales are being compared.
Break-Even Point: The Sales Level Needed to Cover Costs
The break-even point occurs when total revenue equals total costs.
In a basic single-product model, the calculation begins with three figures:
- Fixed costs
- Selling price per unit
- Variable cost per unit
Fixed costs generally remain unchanged across a relevant range of activity. Examples may include rent, fixed salaries, and certain insurance expenses.
Variable costs change with production or sales volume. They may include materials, packaging, and per-unit production expenses.
The difference between selling price and variable cost is called the contribution margin per unit.
Contribution Margin per Unit = Selling Price − Variable Cost per Unit
Each unit sold contributes this amount toward covering fixed costs. Once fixed costs are covered, additional contribution increases operating profit, assuming costs and prices remain consistent.
The break-even formula is:
Break-Even Units = Fixed Costs ÷ Contribution Margin per Unit
Suppose a business has:
- Fixed costs: $12,000
- Selling price: $50 per unit
- Variable cost: $30 per unit
Contribution margin:
$50 − $30 = $20
Break-even point:
$12,000 ÷ $20 = 600 units
The business must sell 600 units to cover the costs included in this model.
For a calculation using your own fixed costs, selling price, and variable costs, use the Break-Even Calculator.
Margin of Safety: The Sales Buffer Above Break-Even
Margin of safety measures the difference between actual or expected sales and break-even sales.
It can be expressed in three useful ways.
Margin of Safety in Units
This measures how many unit sales separate the business from break-even.
Margin of Safety in Units = Actual Sales Units − Break-Even Units
If a business sells 800 units and needs 600 units to break even:
800 − 600 = 200 units
The business can lose 200 unit sales before reaching its break-even level, assuming its selling price and cost structure do not change.
Margin of Safety in Revenue
The same relationship can be measured using sales revenue.
Margin of Safety in Revenue = Actual Sales Revenue − Break-Even Revenue
Suppose actual revenue is $40,000 and break-even revenue is $30,000.
$40,000 − $30,000 = $10,000
The business has a $10,000 revenue buffer above break-even.
Margin of Safety Percentage
The percentage expresses the sales cushion relative to actual or expected sales.
Margin of Safety % = (Actual Sales − Break-Even Sales) ÷ Actual Sales × 100
Using the revenue figures:
($40,000 − $30,000) ÷ $40,000 × 100
Margin of Safety = 25%
This means revenue could decline by 25% from its current level before reaching break-even, provided the assumptions used in the analysis remain valid.
The unit and revenue formulas should use consistent measurements and the same accounting period.
One Business Example Showing Both Measures
Consider a small business selling one type of product.
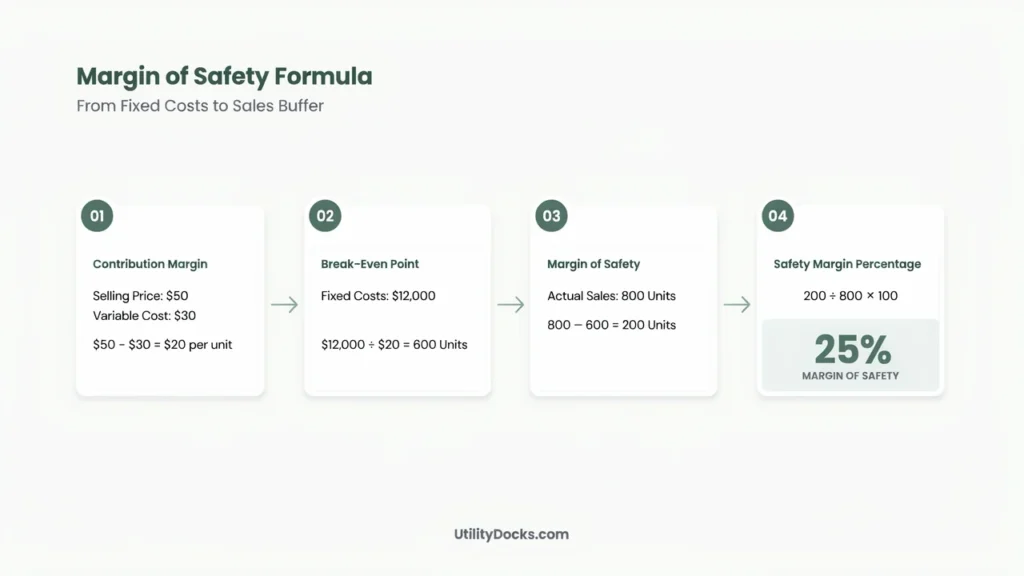
Its monthly figures are:
| Business Metric | Amount |
|---|---|
| Monthly fixed costs | $12,000 |
| Selling price per unit | $50 |
| Variable cost per unit | $30 |
| Actual monthly unit sales | 800 |
Let’s use these figures to understand the relationship between the break-even point and margin of safety.
Step 1: Determine the Contribution Margin
Subtract variable cost from selling price.
$50 − $30 = $20 per unit
Each product sold contributes $20 toward fixed costs and operating profit.
Step 2: Find the Break-Even Point
Divide fixed costs by the contribution margin per unit.
$12,000 ÷ $20 = 600 units
The business must sell 600 units to break even.
Step 3: Compare Actual Sales With Break-Even Sales
Actual monthly sales are 800 units.
Subtract the break-even volume:
800 − 600 = 200 units
The business is selling 200 units above its break-even point.
Step 4: Express the Difference in Revenue
Actual sales revenue:
800 × $50 = $40,000
Break-even sales revenue:
600 × $50 = $30,000
Margin of safety in revenue:
$40,000 − $30,000 = $10,000
Step 5: Express the Safety Margin as a Percentage
Divide the $10,000 sales cushion by actual revenue.
$10,000 ÷ $40,000 × 100 = 25%
The results can be summarized as follows:
| Result | Value |
|---|---|
| Break-even point | 600 units |
| Actual sales | 800 units |
| Margin of safety in units | 200 units |
| Break-even revenue | $30,000 |
| Actual revenue | $40,000 |
| Margin of safety in revenue | $10,000 |
| Margin of safety percentage | 25% |
The break-even point identifies the minimum sales level required to cover costs. The margin of safety identifies the distance between that minimum and the business’s actual performance.
What Does a 25% Margin of Safety Mean?
A 25% margin of safety does not mean that the business earns a 25% profit margin.
It means that 25% of its current sales revenue is above the break-even threshold.
In the example above, revenue could fall from $40,000 to $30,000 before the business reaches break-even.
The interpretation depends on maintaining the underlying assumptions.
If selling prices fall, variable costs increase, or fixed costs change, the break-even threshold may also move.
That is why a margin-of-safety percentage should be interpreted alongside the business’s costs and sales expectations rather than treated as a permanent measure.
What Happens When Sales Fall Below Break-Even?
Margin of safety can be positive, zero, or negative.
Consider the same business with a break-even point of 600 units.
| Actual Sales | Margin of Safety | Margin of Safety % |
|---|---|---|
| 500 units | -100 units | -20% |
| 600 units | 0 units | 0% |
| 700 units | 100 units | 14.29% |
| 800 units | 200 units | 25% |
The percentage in this table uses actual unit sales as the denominator.
Positive Margin of Safety
When actual sales exceed break-even sales, the margin of safety is positive.
At 800 units, the business has a 200-unit cushion.
Zero Margin of Safety
When actual sales equal break-even sales, the margin of safety is zero.
At 600 units, the business has covered the costs included in its break-even analysis, but it has not generated an operating profit.
Negative Margin of Safety
When actual sales fall below break-even, the margin of safety becomes negative.
At 500 units:
500 − 600 = -100 units
The business is 100 units below the sales level required to cover costs.
This is a shortfall rather than a protective buffer.
How Changes in Costs Affect the Margin of Safety
A business can lose part of its safety margin even when sales remain unchanged.
To see why, return to the original example.
The business sells 800 units each month, with a contribution margin of $20 per unit.
Its original fixed costs are $12,000, producing a break-even point of 600 units.
Now suppose monthly fixed costs rise to $14,000.
The new break-even point becomes:
$14,000 ÷ $20 = 700 units
Actual sales are still 800 units, but the margin of safety changes.
800 − 700 = 100 units
The new margin-of-safety percentage is:
100 ÷ 800 × 100 = 12.5%
Compare the original and revised figures:
| Metric | Original | After Fixed Costs Increase |
|---|---|---|
| Fixed costs | $12,000 | $14,000 |
| Break-even units | 600 | 700 |
| Actual sales | 800 | 800 |
| Margin of safety | 200 units | 100 units |
| Margin of safety percentage | 25% | 12.5% |
Sales did not decline, but the safety margin was cut in half.
This illustrates why changes in a business’s cost structure can affect its position even when revenue appears stable.
Selling price and variable cost changes can also affect the break-even point by changing contribution margin per unit.
For example, a lower selling price with unchanged variable cost leaves less contribution from each unit. More sales may then be required to cover fixed costs.
The opposite can happen when contribution per unit increases.
Is Margin of Safety the Same as Gross Profit Margin?
No. The word “margin” appears in both terms, but the measurements are different.
Margin of safety compares actual or expected sales with break-even sales.
Gross profit margin compares gross profit with sales revenue.
The formulas are:
Margin of Safety % = (Actual Sales − Break-Even Sales) ÷ Actual Sales × 100
Gross Profit Margin % = Gross Profit ÷ Revenue × 100
A business could have a substantial gross margin on its products while still operating close to break-even because of high fixed costs.
Likewise, a business with a relatively modest gross margin may operate comfortably above break-even if its sales volume and cost structure support that position.
For more information about gross margin and its relationship with markup, see Profit Margin vs Markup.
Limitations of Break-Even and Margin-of-Safety Analysis
These measures are useful, but their results depend on the assumptions behind the calculations.
Costs May Not Remain Constant
Fixed costs can increase when a business expands production capacity, adds staff, or moves to larger premises.
Variable costs may also change because of supplier pricing, purchasing volumes, or production conditions.
A break-even point based on outdated costs may no longer represent the business’s current position.
Selling Prices Can Change
Discounts, competition, and changes in demand may affect selling prices.
If the average selling price declines, the contribution earned from each sale may decrease.
That can raise the number of units required to break even.
Multiple Products Complicate the Calculation
The simple single-product formula assumes one selling price and one variable cost per unit.
A business selling multiple products must also consider its sales mix.
If customers begin purchasing a larger share of lower-contribution products, the overall break-even level can change even when total sales remain similar.
Forecasts Are Not Guaranteed Sales
A business may calculate its expected margin of safety using a sales forecast.
That forecast is useful for planning, but the resulting margin of safety is not an actual buffer until sales occur.
Actual and forecasted figures should be clearly distinguished.
A Large Safety Margin Does Not Eliminate Business Risk
Margin of safety examines sales relative to break-even under a defined cost-volume-profit model.
It does not, by itself, establish whether a business has enough cash to pay upcoming obligations or withstand every type of unexpected expense.
It should be considered alongside other financial and operational information.
Frequently Asked Questions
What is the difference between break-even point and margin of safety?
Break-even point measures the sales needed to cover total costs. Margin of safety measures the difference between actual or expected sales and break-even sales. One establishes the threshold, while the other measures the sales buffer or shortfall relative to that threshold.
How is margin of safety calculated from break-even sales?
Subtract break-even sales from actual or budgeted sales.
Margin of Safety = Actual Sales − Break-Even Sales
To calculate the percentage, divide the result by actual or budgeted sales and multiply by 100.
Can margin of safety be negative?
Yes. A negative margin of safety means actual or expected sales are below the break-even level. Under the assumptions used in the analysis, the business would be operating at a loss.
What does a 20% margin of safety mean?
A 20% margin of safety means that sales could decline by 20% from the measured sales level before reaching break-even, assuming the cost structure, selling prices, and other relevant conditions remain unchanged.
Is margin of safety the same as profit margin?
No. Margin of safety measures the difference between sales and the break-even threshold. Profit margin measures profit as a percentage of revenue. They serve different purposes.
Can a business have a high break-even point and a high margin of safety?
Yes. A business with a high break-even point can still have a substantial margin of safety if actual sales are sufficiently above that threshold.
For example, break-even sales of $500,000 and actual sales of $1,000,000 produce a 50% margin of safety.
Does margin of safety change when fixed costs increase?
It can. If fixed costs rise while contribution margin per unit and actual sales stay unchanged, the break-even point increases and the margin of safety decreases.
Is margin of safety based on actual or budgeted sales?
Either can be used, depending on the purpose of the analysis.
Actual sales describe the margin of safety achieved during a period. Budgeted or forecasted sales describe the expected margin of safety for a planned period.
The chosen basis should be clearly identified.
Understanding the Sales Threshold and the Sales Cushion
The relationship between break-even point and margin of safety comes down to two questions:
Break-even point: How much must the business sell to cover its costs?
Margin of safety: How far are actual or expected sales from that level?
Using both measures gives businesses a clearer view of the relationship between sales performance and the costs that must be covered.
The break-even point establishes the threshold. The margin of safety shows the distance from it.
For additional pricing and profitability resources, visit the Business Pricing tools.
Sources Used for Fact Checking
- OpenStax, Principles of Accounting, Volume 2: Managerial Accounting
- GoCardless, Break-Even Point vs. Margin of Safety
- GoCardless, How to Calculate Margin of Safety
- OpenStax, Cost-Volume-Profit Analysis and Margin of Safety